Visualize, Analyze and Simulate
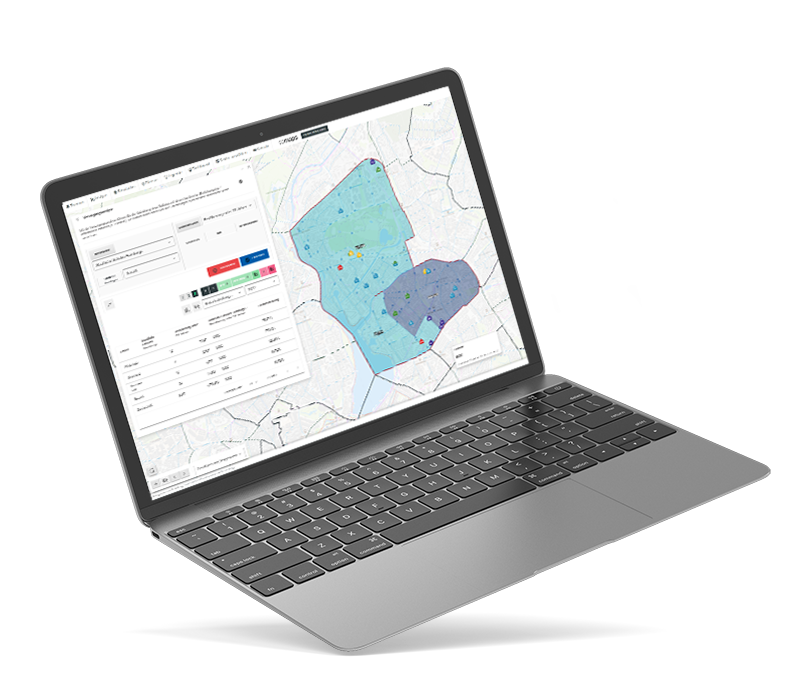
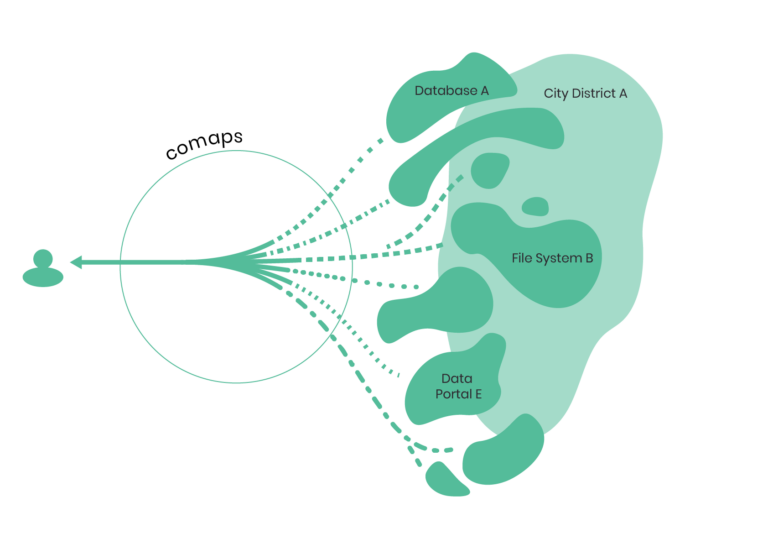
Comaps is a map-based planning and analysis tool. It is used for data-supported decision-making in urban development. The application integrates spatial and statistical data from various sources and enables standardised visualisations, analyses and simulations of planning scenarios. It simplifies the work of planners and avoids time-consuming data procurement.
Visualisieren
Analysieren
Simulieren
Comaps is a map-based planning and analysis tool. It is used for data-supported decision-making in urban development. The application integrates spatial and statistical data from various sources and enables standardised visualisations, analyses and simulations of planning scenarios. It simplifies the work of planners and avoids time-consuming data procurement.

Social systems are complex.
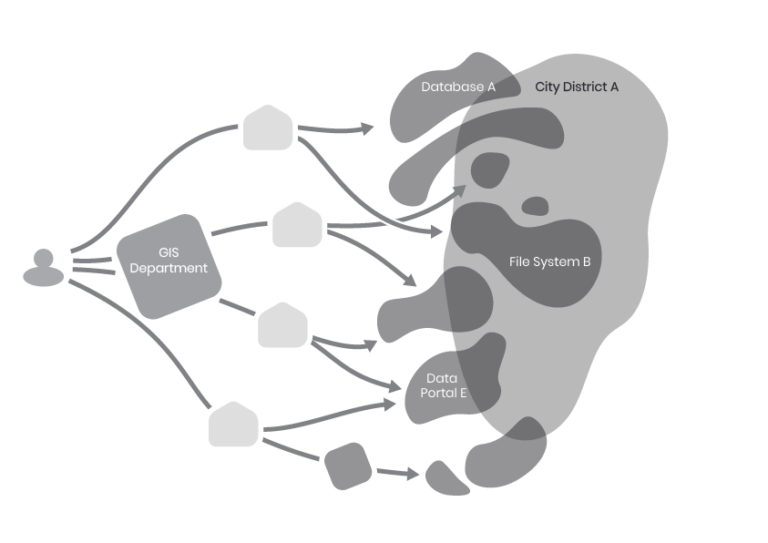
Social systems are intricate, particularly given the diverse challenges such as demographic shifts and climate crises. Urban planning must navigate the complexities by identifying needs, carefully assessing decision consequences, and ensuring effective communication. However, the process is hindered by fragmented data, dispersed responsibilities, and limited resources within GIS and data departments. Comaps streamlines the integration of GIS analyses into urban planning and simplifies this process. As an open-source tool, it ensures security and openness.


Sharing visions together
"Even if each of us plays only one note, together we can create a symphony."
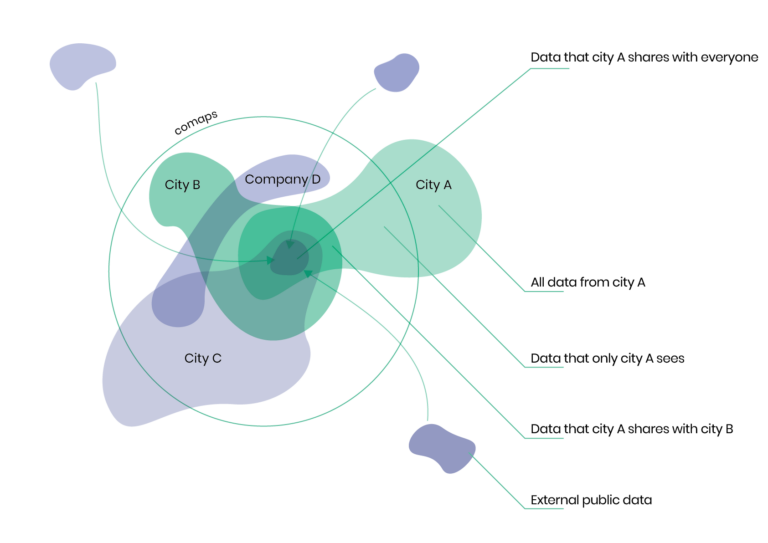
Durch eine kollaborative Arbeitsumgebung, profitieren unterschiedliche Akteure davon, ihre Daten zu teilen. Daten In a collaborative environment, various participants benefit from sharing data. Information from diverse sources enables precise analyses and forecasts. You decide which data you make visible to whom, share work statuses and publish results. You retain full control over your data landscape.

Hallerstraße 50
20146 Hamburg
info@comaps.de
+49 (0) 152 336 414 05
Amtsgericht Hamburg
Registernummer: HRB 182119
Gefördet durch:

Gefördet durch:

comaps GmbH
Hallerstraße 50
20146 Hamburg
info@comaps.de
+49 (0) 152 336 414 05
Amtsgericht Hamburg
Registernummer: HRB 182119