Functions
Our core functions for planning sustainable neighbourhoods and integrating socio-demographic data can be found here:
Demand response
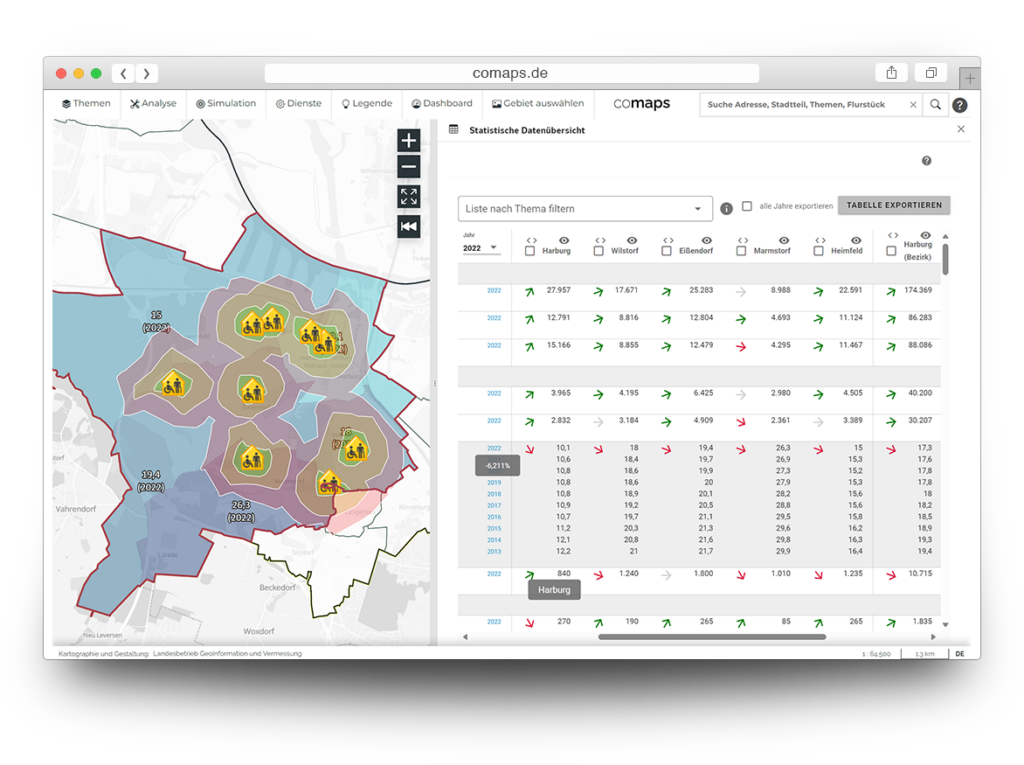
Analyses of needs can be created with one click. Exemplary analyses include, for instance, healthcare, offices, green spaces, daycare centres, public transport and much more. Significant gaps in demand can be identified here according to your own requirements.
Data use
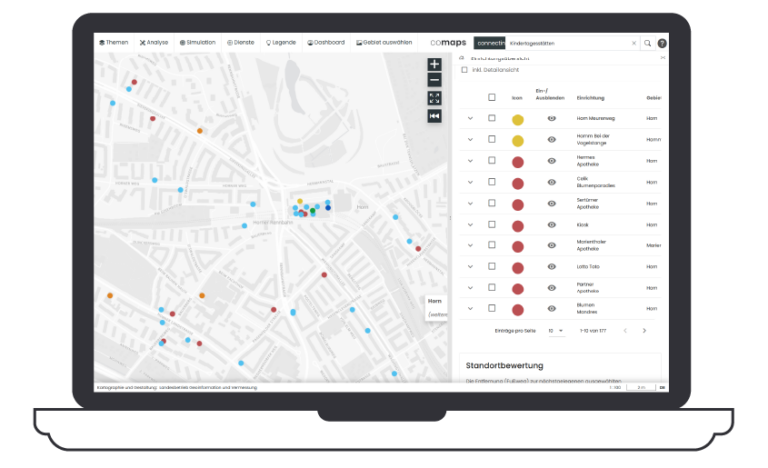
Users can either connect their own data or access open-source data curated by comaps in collaboration with the City Science Lab Hamburg. Own data can be connected in a self-explanatory way and is only visible to selected users. The open-source data can be displayed together with your own data in order to visualise new connections.
Future prognoses
The future projections are based on the expected population growth in the selected area. The projections are derived and extrapolated from official data sets, such as the census and various state and federal offices. The population itself is also divided into small-scale structures. This means that planning decisions can be made before the opportunity has expired.
Accessibility analyses
Any location can be checked for accessibility and gaps can be identified. Comaps asks for the type of movement (on foot, wheelchair, car, etc.) and the unit of measurement (metres vs. time). The self-configured analysis can be easily read across the entire area in isochrones according to the street grid.
Development of Scenarios
Future planned construction projects can be created in comaps' virtual space to test how well they work in the overall spatial concept. These what-if scenarios can be used to create entire residential neighbourhoods or simply individual infrastructure projects.
Trend analysis
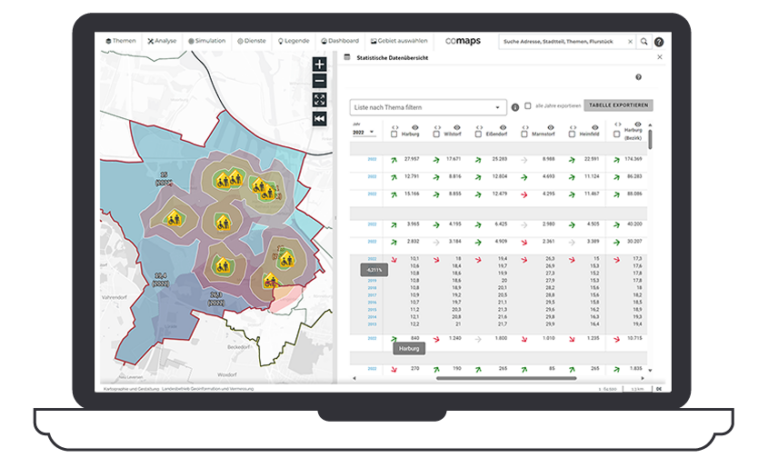
Comaps enables recognising emerging trends at a glance. Based on socio-demographic developments in a street, for example, comaps makes reference to new construction projects and urban offers. From this, comaps' users can then derive trends in holistic neighbourhood development.
Templates for Data visualisation
Some team leaders also want other employees to work with comaps and want to make the application as beginner-friendly as possible. To do this, they create templates that only make selected data and functions visible so that everyone can find their way around.
Publication
All analyses, findings and correlations can be published for a wider audience. No additional users need to be introduced to the software, still, political committees or management meetings can easily use these publications.
Use Cases
Users from various industries regularly use comaps in their day-to-day work. Which use cases has comaps already solved for individuals?
Use-Case Example
Effective Collaboration and Communication
The Challenge
The chambers of commerce represent the interests of their member companies. They are all dependent on satisfied employees with a high quality of life. That's why chambers of commerce spend many weeks of intensive research preparing elaborate reports and concepts.
Comaps' Role
Through our tool, employees of the chamber of commerce can in no time pull up all the data of e.g. quality of life in a given district and visualise it for reports and projects.
Use-Case Example
Instant Insights and Information
The Challenge
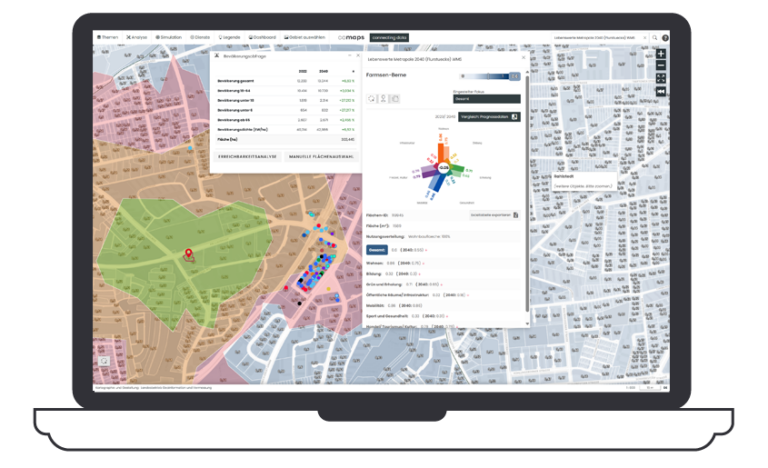
Sara besitzt eine Menge an Datensätzen. Diese musste sie aber immer einzeln betrachten und konnte keine direkten Zusammenhänge erkennen. Es hat sie viel Zeit, Geduld und Nerven gekostet Versorgungslücken für jeden Standort einzeln zu identifizieren.
Comaps' Role
Comaps zeigt ÖPNV-Anbindung, den Grünraum, die Bildungsangebote, die Gesundheitsversorgung, etc. alles in einer Karte. Seit Sara comaps nutzt, macht sie die Erreichbarkeitsanalyse und Versorungsanalysen mit zwei Klicks.
Use-Case Example
Geeignete Standorte für Vorhaben finden
The Challenge
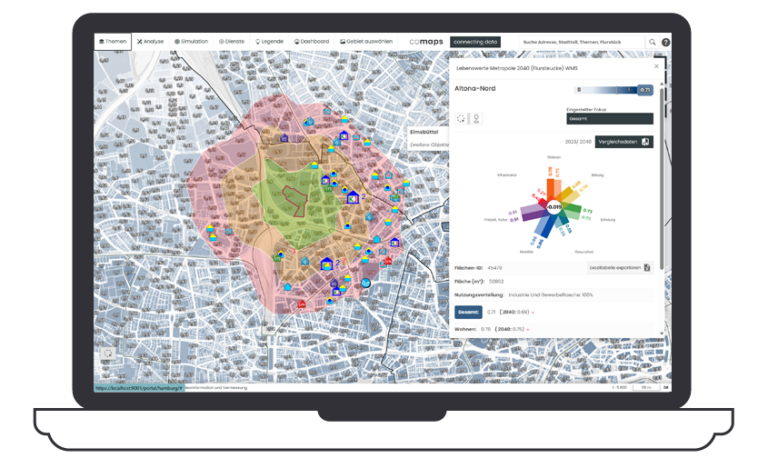
Mitarbeitende von etablierten Beratungsunternehmen müssen geplante Bauvorhaben prüfen, neue Potentiale entdecken und möglichst korrekte Zukunftsprognosen anbieten. Dafür sitzen sie erst tagelang vor Excel-Tabellen mit räumlichen Daten, um diese dann alleinstehend betrachten zu können.
Comaps' Role
Comaps verbindet alle Datensätze, ob aus Excel oder geo-referenzierten Formaten. User sehen eine Kartenansicht, die ihre eigenen und öffentliche Daten enthält. Außerdem ermöglichen sozio-demografische Daten Zukunftsprognosen.
Use-Case Example
Standortqualitäten erkennen und Programme planen
The Challenge
Fehlerhafte Planung führt zu geringeren Einnahmen oder im schlimmsten Fall zu Leerstand. Viel Geld geht verloren und der Immobilienwert sinkt signifikant. Die Umnutzungs-Kosten sind immens und es benötigt neue große Investments. Die finanziellen Risiken sind eine große Herausforderung.
Comaps' Role
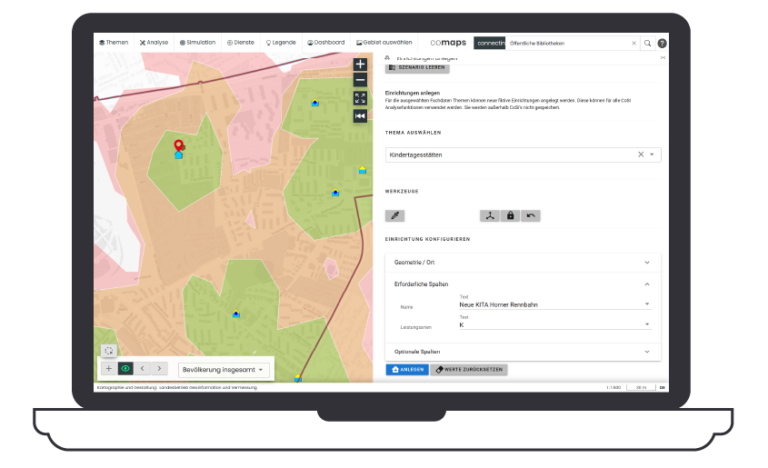
Comaps führt Analysen durch, die auf selbst festgelegten Kriterien basieren. Philipp suchte zum Beispiel für ein potentiell neues Objekt nach ÖPNV-Anbindungen und bringt es mit der Bevölkerungswachstumsprognosen in Verbindung.
Use-Case Example
Integrierte Handlungskonzepte entwickeln
The Challenge
Architekt:innen erstellen regelmäßig Nutzungskonzepte, für die sie selten bezahlt werden. Diese sorgfältig auszuarbeiten, verschluckt Unmengen an Ressourcen. Danach basieren Sie häufig auf veralteten Daten, die den Anforderungen der Ausschreibungen nicht mehr standhalten.
Comaps' Role
Comaps hat die aktuellste Version aller Daten für ganz Deutschland auf einen Blick. Das Anlegen von Szenarien ermöglicht das Eingehen auf demographische Entwicklungen und zeigt Risiken für potentiellen Leerstand in der Zukunft an.

Data Security und Sovereignty
Comaps is not a data platform, which means that all data remains on the customer’s own infrastructure. We do not trade in data and do not maintain any data storage.
For complex analyses, session backups, and content sharing, only anonymized data is sent to our server and is subsequently synchronized locally with your system.
Warum comaps
Profitieren Sie ebenfalls von unserem Angebot
Reliable
95% availability on secure, ISO-certified servers in Germany
Platform-independent
Access your data from anywhere—on desktop, mobile, or touchscreens
Seamless Collaboration
Low-maintenance
No need for server upkeep, maintenance, or manual updates
Data planning assistance
Comprehensive support for data-driven planning
Map-based
Intuitive linking of statistics with spatial contexts
Quick Integration
Seamless integration of new data using open standards and upload tools
No Installation
No time-consuming downloads, installations or additional costs
Nutzerfreundlich
User-friendly interface and tools—no GIS expertise required
Transparent
Transparent, reproducible results powered by open-source components
Datenquellen und Datenformate
Data Sources
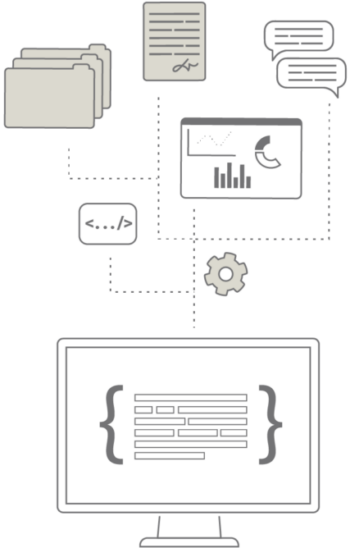
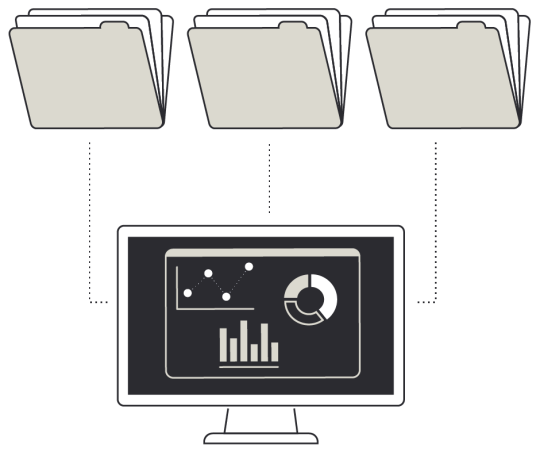
Data forms the foundation for visualization, analysis, and planning with comaps. In addition to the data you provide, we offer an extensive collection of publicly available data umfangreiche Sammlung öffentlich zugänglicher Daten, die wir kontinuierlich erweitern. Auf Anfrage beschaffen wir auch nicht-öffentliche Daten für Sie, wie beispielsweise Immobilienmarktberichte that we continuously expand. Upon request, we can also obtain non-public data for you, such as real estate market reports or detailed election results. By strategically combining and harmonizing data from various sources, we create significant added value for your planning projects.
BKG Basemap
OpenStreetMap + OpenStreetMap POI
DESTASIS
Öffentlicher Naheverkehr
ALKIS
XPlan
Your Data
Und mehr…
OpenStreetMap + OpenStreetMap POI
BKG Basemap
DESTASIS
Statistikamt Nord
Öffentlicher Naheverkehr
ALKIS
SensorThings
Your Data
And more...
Data Formats
Comaps supports all common data formats
and services, both georeferenced and non-georeferenced. As an additional service, we offer conversion of other data formats, such as CSV, Excel, or PDF, into compatible formats. This includes, for example, transforming plans in PDF format or Excel files with statistical data for use comaps.
WFS and WMS
OGC API Feature
GeoJSON
WFS and WMS
ESRI Shapefile
Geopackage
ESRI Shapefile
KML, GPX, GFTS, CSV
SensorThings
Mapbox VectorTiles
And more...
WFS and WMS
OGC API Feature
GeoJSON
WFS and WMS
ESRI Shapefile
Geopackage
ESRI Shapefile
KML, GPX, GFTS, CSV
SensorThings
Mapbox VectorTiles
And more...
Kontaktieren Sie uns ↳
WFS and WMS
OGC API Feature
GeoJSON
ESRI Shapefile
Geopackage
KML, GPX, GTFS, CSV
SensorThings
Mapbox VectorTiles
And more...
